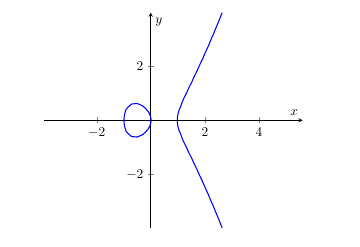
Eine alternative Lösung mit pgfplots und raw gnuplot, Voraussetzungen (gnuplot, shell-escape bzw. write18) wie in meiner anderen Antwort.
Open in writeLaTeX
\documentclass{article}\usepackage{pgfplots}\begin{document}\begin{tikzpicture}\begin{axis}[
      axis x line = middle,
      axis y line = middle,
      axis equal,
      xlabel = {$x$},
      ylabel = {$y$},
      restrict y to domain = -4:4,
    ]
    \addplot + [
      no markers,
      raw gnuplot,
      thick,
      ]
      gnuplot {
        set contour base;
        set cntrparam levels discrete 0.01;
        unset surface;
        set view map;
        set isosamples 300;
        splot y**2 - x**3 + x;
      };
  \end{axis}\end{tikzpicture}\end{document}